In the age of 5G and ubiquitous high-speed mobile internet, we often take the seamless connection for granted. We stream high-definition video, make crystal-clear video calls, and download large files in seconds, rarely questioning the underlying magic. Yet, the invisible environment that enables this—the radio frequency (RF) spectrum—is complex, volatile, and highly competitive.
Your smartphone is constantly performing sophisticated measurements to navigate this environment. When you see “full bars” of signal strength, that simple icon is a synthesis of critical, standardized metrics. Understanding these metrics—RSRP, RSSI, RSRQ, and SINR—is essential for network engineers optimizing coverage, field technicians troubleshooting drops, and curious users wondering why their connection lags even when the bars are high.
These four metrics define the health, quality, and capability of your connection to the cell tower. They measure different aspects of the received radio signal, and each provides a unique piece of the diagnostic puzzle.
1. RSRP: Reference Signal Received Power (The Core Signal)
RSRP, or Reference Signal Received Power, is the foundational measurement of physical signal strength in LTE (4G) and 5G networks. When people talk about “signal strength,” they are often, perhaps without knowing it, referring to RSRP.
In modern cellular networks, the base station (the “cell tower”) transmits special, standardized signals known as Reference Signals. These are like highly specific beacon lights that never change their identity. They are distributed across the entire frequency band used by the cell. Your phone specifically looks for these Reference Signals and measures the power level of only these specific beacons.
This is a critical distinction. The phone ignores user data traffic, interference from other cells, and random background thermal noise. It focuses solely on the power arriving from the specific cell it is monitoring.
The conceptual illustration below (Figure 1) visualizes this measurement.
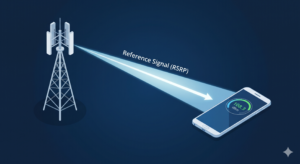
Figure 1: Conceptual illustration of RSRP. Only a specific, focused reference signal beam (the beacon) is measured by the user device, ignoring all ambient noise and interference. The background is depicted as a void, emphasizing the exclusivity of the measurement.
As shown in Figure 1, RSRP is an exclusive measure of signal power from the base station antenna. Because RSRP measures only a fraction of the total channel bandwidth (just the reference symbols), its absolute value is always quite low.
RSRP is measured in dBm (decibel-milliwatts). A typical RSRP range might be from -70 dBm (excellent) down to -120 dBm (the edge of coverage, where calls might drop). RSRP is the primary metric the phone uses to decide when to handover your ongoing connection from one cell tower to a neighboring one as you move.
RSRP Ranges (dBm):
>-80 dBm: Excellent (strong signal, very close to the tower)
-80 to -90 dBm: Good (reliable connection)
-90 to -100 dBm: Fair to Poor (usable, but speeds may decrease)
<-110 dBm: Very Poor (potential connection issues, frequent handovers)
2. RSSI: Received Signal Strength Indicator (The Total Power)
While RSRP is surgical in its focus, RSSI (Received Signal Strength Indicator) is an all-encompassing measurement. It measures the total power received across the entire relevant frequency band.
In the 2G and 3G eras, RSSI was the main indicator of signal strength. However, in 4G and 5G, where multiple cells can reuse frequencies and complex modulation is used, RSSI can be misleading.
Think of it this way: RSRP is measuring the brightness of a single, specific lighthouse beacon (the Reference Signal). RSSI is measuring the total amount of light entering your eye from everywhere—the lighthouse, streetlamps, passing cars, reflections off the water, and random light pollution.
Figure 2 visualizes this concept, explicitly contrasting with the clean measurement seen in Figure 1.
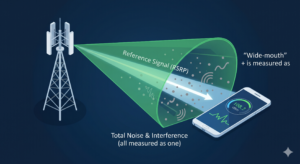
Figure 2: Conceptual illustration of RSSI. In this visualization, the device uses a wide ‘funnel’ to collect all energy, including the weak reference signal (from Figure 1) plus scattered grey noise particles, abstract interference waves, and signals from other cells. Text labels confirm “Total Power (RSSI)” includes everything.
As Figure 2 shows, the RSSI measurement is wide and inclusive. Crucially, the phone only measures RSSI when it is also receiving data. Because it includes all energy (signal + interference + noise), RSSI will always be higher (less negative) than RSRP. A phone can report an extremely strong RSSI (-50 dBm) even if the desired RSRP (-100 dBm) is very weak, simply because the ambient noise and interference are overwhelming. This is why RSSI alone is an insufficient gauge of connection quality in modern networks.
3. RSRQ: Reference Signal Received Quality (The Signal-to-Noise Ratio)
Once you have RSRP (the strength of your signal beacon) and RSSI (the total power in the environment, including the background mess), you can calculate the efficiency and reliability of that signal. This is where RSRQ, or Reference Signal Received Quality, comes into play.
RSRQ provides a measurement of signal quality, and it is a key metric the network uses to manage capacity and prioritize resources.
Mathematically, RSRQ is derived from the RSRP and RSSI:
RSRQ = (N × RSRP) / RSSI (Where N is the number of Resource Blocks across the entire bandwidth).
This formula shows that RSRQ is essentially a ratio: it compares the power of the desired signal (RSRP, scaled for the entire bandwidth) against the total, chaotic mess of power (RSSI).
This comparison is visualized in Figure 3.
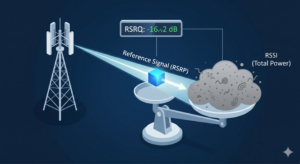
Figure 3: Conceptual illustration of RSRQ. This image reuses established visuals: the clean RSRP ‘signal beacon’ (from Figure 1, now a clean blue cube) is placed on a mechanical scale to balance against the heavy, messy ‘RSSI noise cloud’ (from Figure 2). RSRQ is visualized as the resulting balance/ratio, measuring the signal’s quality.
In Figure 3, we see the relationship visualized as a scale. The small, efficient signal cube (RSRP) must “balance” or prove its value against the heavy, amorphous noise cloud (RSSI). A “heavy” RSSI (full of noise and interference) will tilt the scale and result in a low RSRQ value, indicating poor quality, even if the absolute RSRP power is high.
RSRQ is measured in dB (decibels) and usually ranges from -3 dB (perfect) to -20 dB (very poor). A low RSRQ often indicates high interference from neighboring cell towers (inter-cell interference).
RSRQ Ranges (dB):
>-5 dB: Excellent (High throughput potential)
-5 to -10 dB: Good (Reliable performance)
-11 to -15 dB: Fair to Poor (Reduced speeds, potential issues)
<-18 dB: Very Poor (High cell interference, connection likely unusable)
4. SINR: Signal-to-Interference-plus-Noise Ratio (The Usability Metric)
The final and arguably most critical metric for user experience is SINR (Signal-to-Interference-plus-Noise Ratio). While RSRP measures signal strength and RSRQ measures quality based on total received energy, SINR measures the clarity of the connection.
SINR provides the ultimate measure of how effectively the phone can distinguish the desired information (the user data) from the surrounding chaos of interference and random noise.
The formula defines it simply:
SINR = S / (I + N)
(Where S is the Desired Signal, I is Interference, and N is Noise).
If interference (I) and noise (N) are very high, the SINR will be low, regardless of the signal power (S). A low SINR makes it mathematically difficult for the phone to correctly decode the incoming data packets. This results in errors, retransmissions, and slow effective speeds (throughput).
SINR is the closest metric to what you experience as “usable speed.” Figure 4 provides a powerful visualization of this clarity concept.
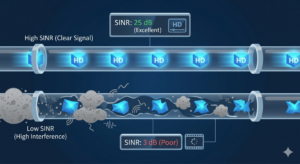
Figure 4: Conceptual illustration of SINR. This diagram reuses the clean blue data/light visuals for the desired ‘Signal’ (derived from the beam in Figure 1). High SINR (top, 25 dB) results in a clear pipeline with perfect data packets flowing effortlessly (HD video). Low SINR (bottom, 3 dB) shows the same messy grey noise and interference (from Figure 2 and Figure 3) aggressively invading the pipeline, corrupting the blue data packets and causing buffering.
As seen in Figure 4, high SINR provides a clean, transparent pipe, allowing complex modulation schemes (like 256QAM) to transmit vast amounts of data simultaneously. In contrast, low SINR forces the system to use robust but much slower modulation (like QPSK), and even then, packets arrive broken (corrupted by the invading interference cloud) and require retransmission.
Like RSRQ, SINR is measured in dB.
SINR Ranges (dB):
>20 dB: Excellent (Ideal for peak throughput)
13 to 20 dB: Good (Reliable high speeds)
0 to 12 dB: Fair to Poor (Speeds highly variable)
<0 dB: Very Poor (Signal is weaker than the combined noise/interference; connection likely unusable)
Summary and Real-World Interaction
These four metrics do not exist in isolation; they continuously interact to define your connection.
A high RSRP is a prerequisite: it provides the essential volume needed to receive any signal. Without power, the other metrics are irrelevant.
The gap between RSRP and RSSI tells you about the ambient “noise floor” and the presence of traffic. A massive gap suggests a very noisy environment.
A low RSRQ warning suggests your efficient signal beacon (RSRP) is fighting against heavy environmental energy (RSSI).
Ultimately, the SINR dictates usability. It doesn’t just measure total energy (like RSRQ); it specifically contrasts the power of your desired data transmission against the harmful interference (I) and random background noise (N) that actively hinder reception.
When you hold your phone and observe five bars, it likely indicates strong RSRP (>-80 dBm) and high SINR (>20 dB). However, if you have five bars but cannot load a webpage, the problem might be quality: perhaps the RSRQ is extremely poor (<-18 dB) due to severe interference, or the SINR is very low (<0 dB) because, despite strong power, your connection is overwhelmed by interference from neighboring cells (high ‘I’ in the SINR formula). In this scenario, your phone sees the strong beacon (strong RSRP) but cannot differentiate the data from the surrounding noise.
Understanding RSRP, RSSI, RSRQ, and SINR moves us beyond the simplicity of “signal bars” and into the reality of modern RF engineering: a wireless world where power, quality, clarity, and interference are constantly balanced to deliver the connectivity we demand.